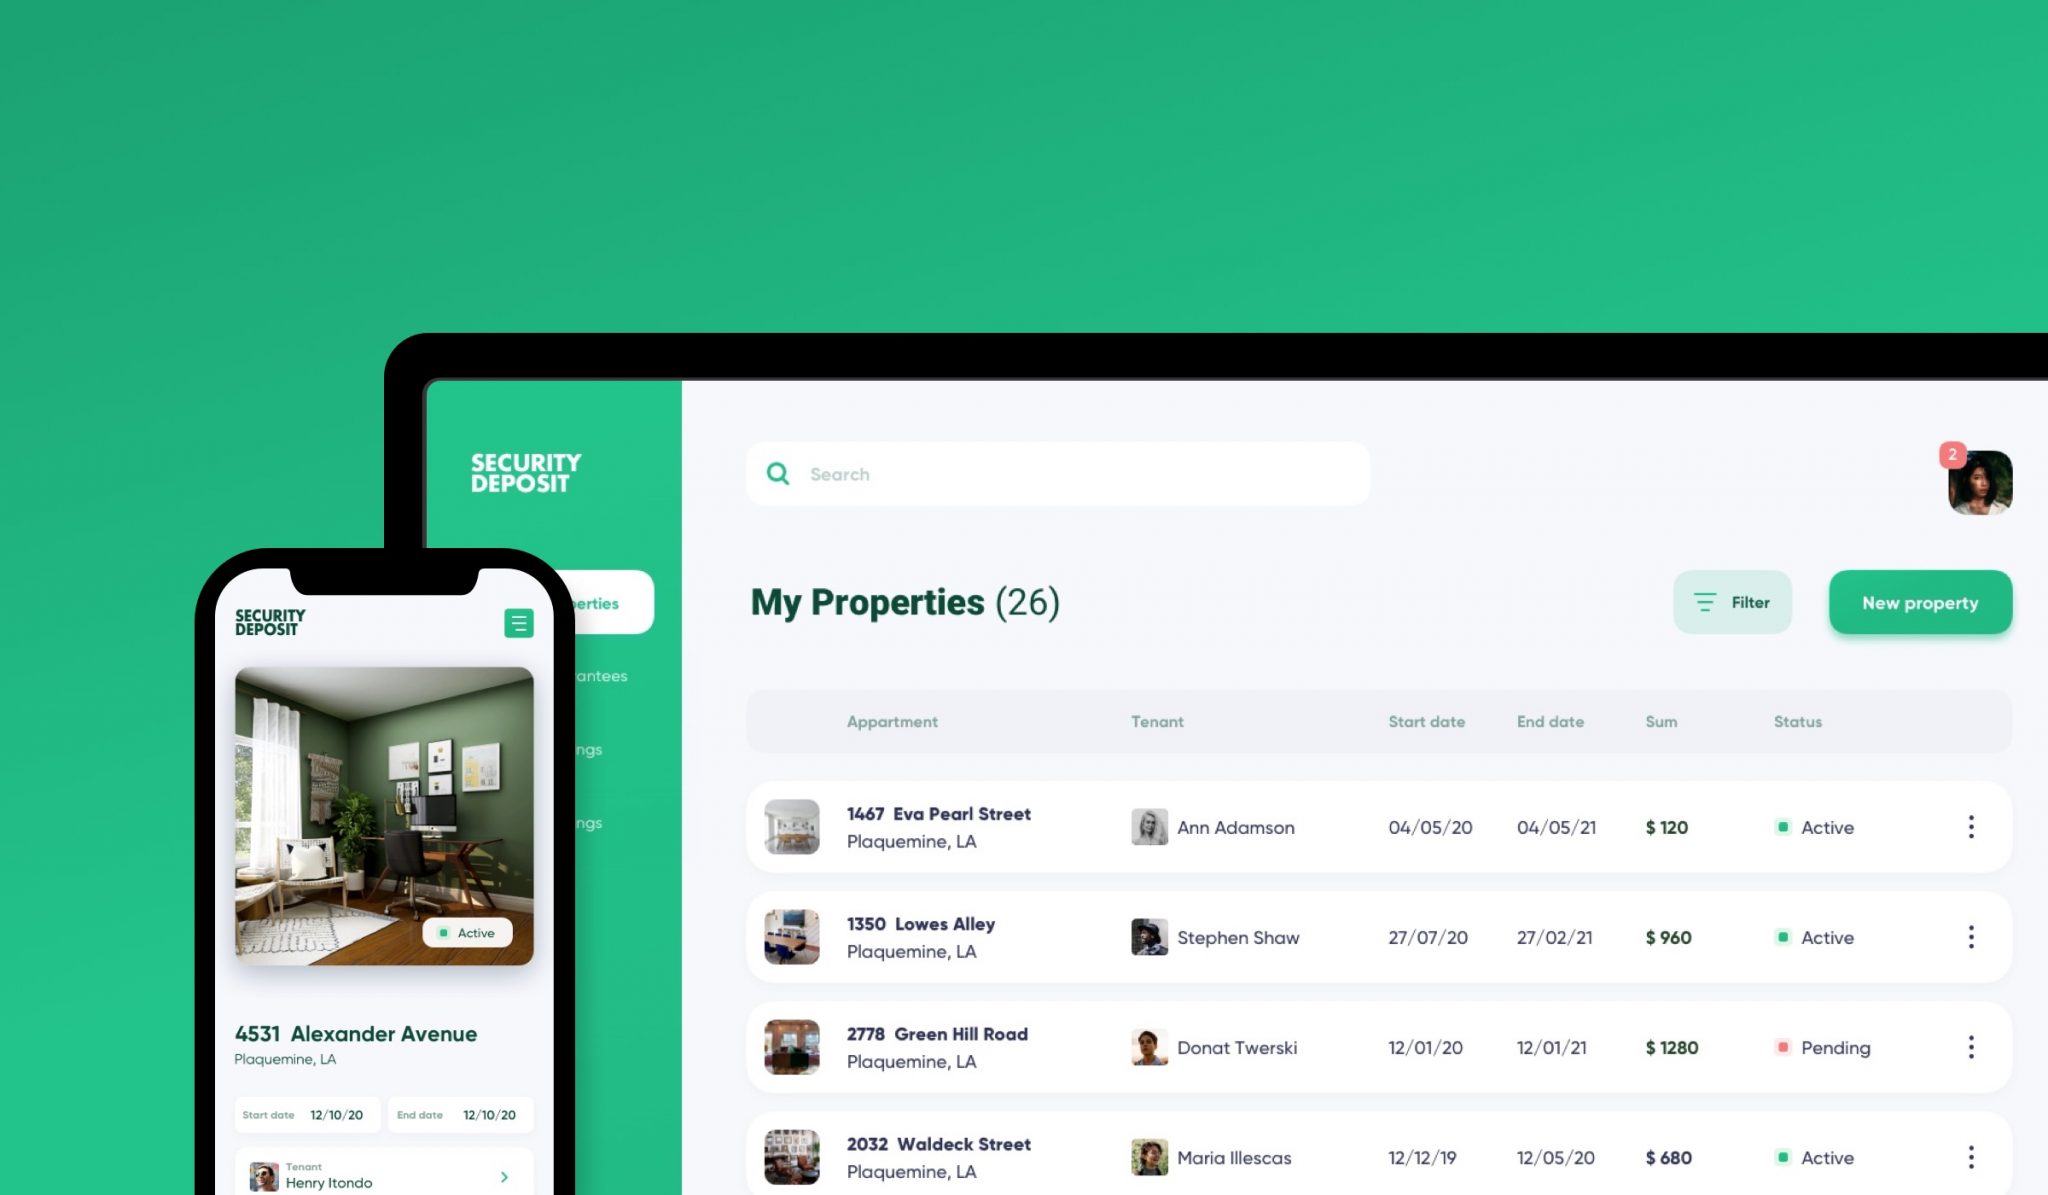
Our team helped an international fintech company to develop an innovative approach in B2C deposit guarantee operations for the European market.


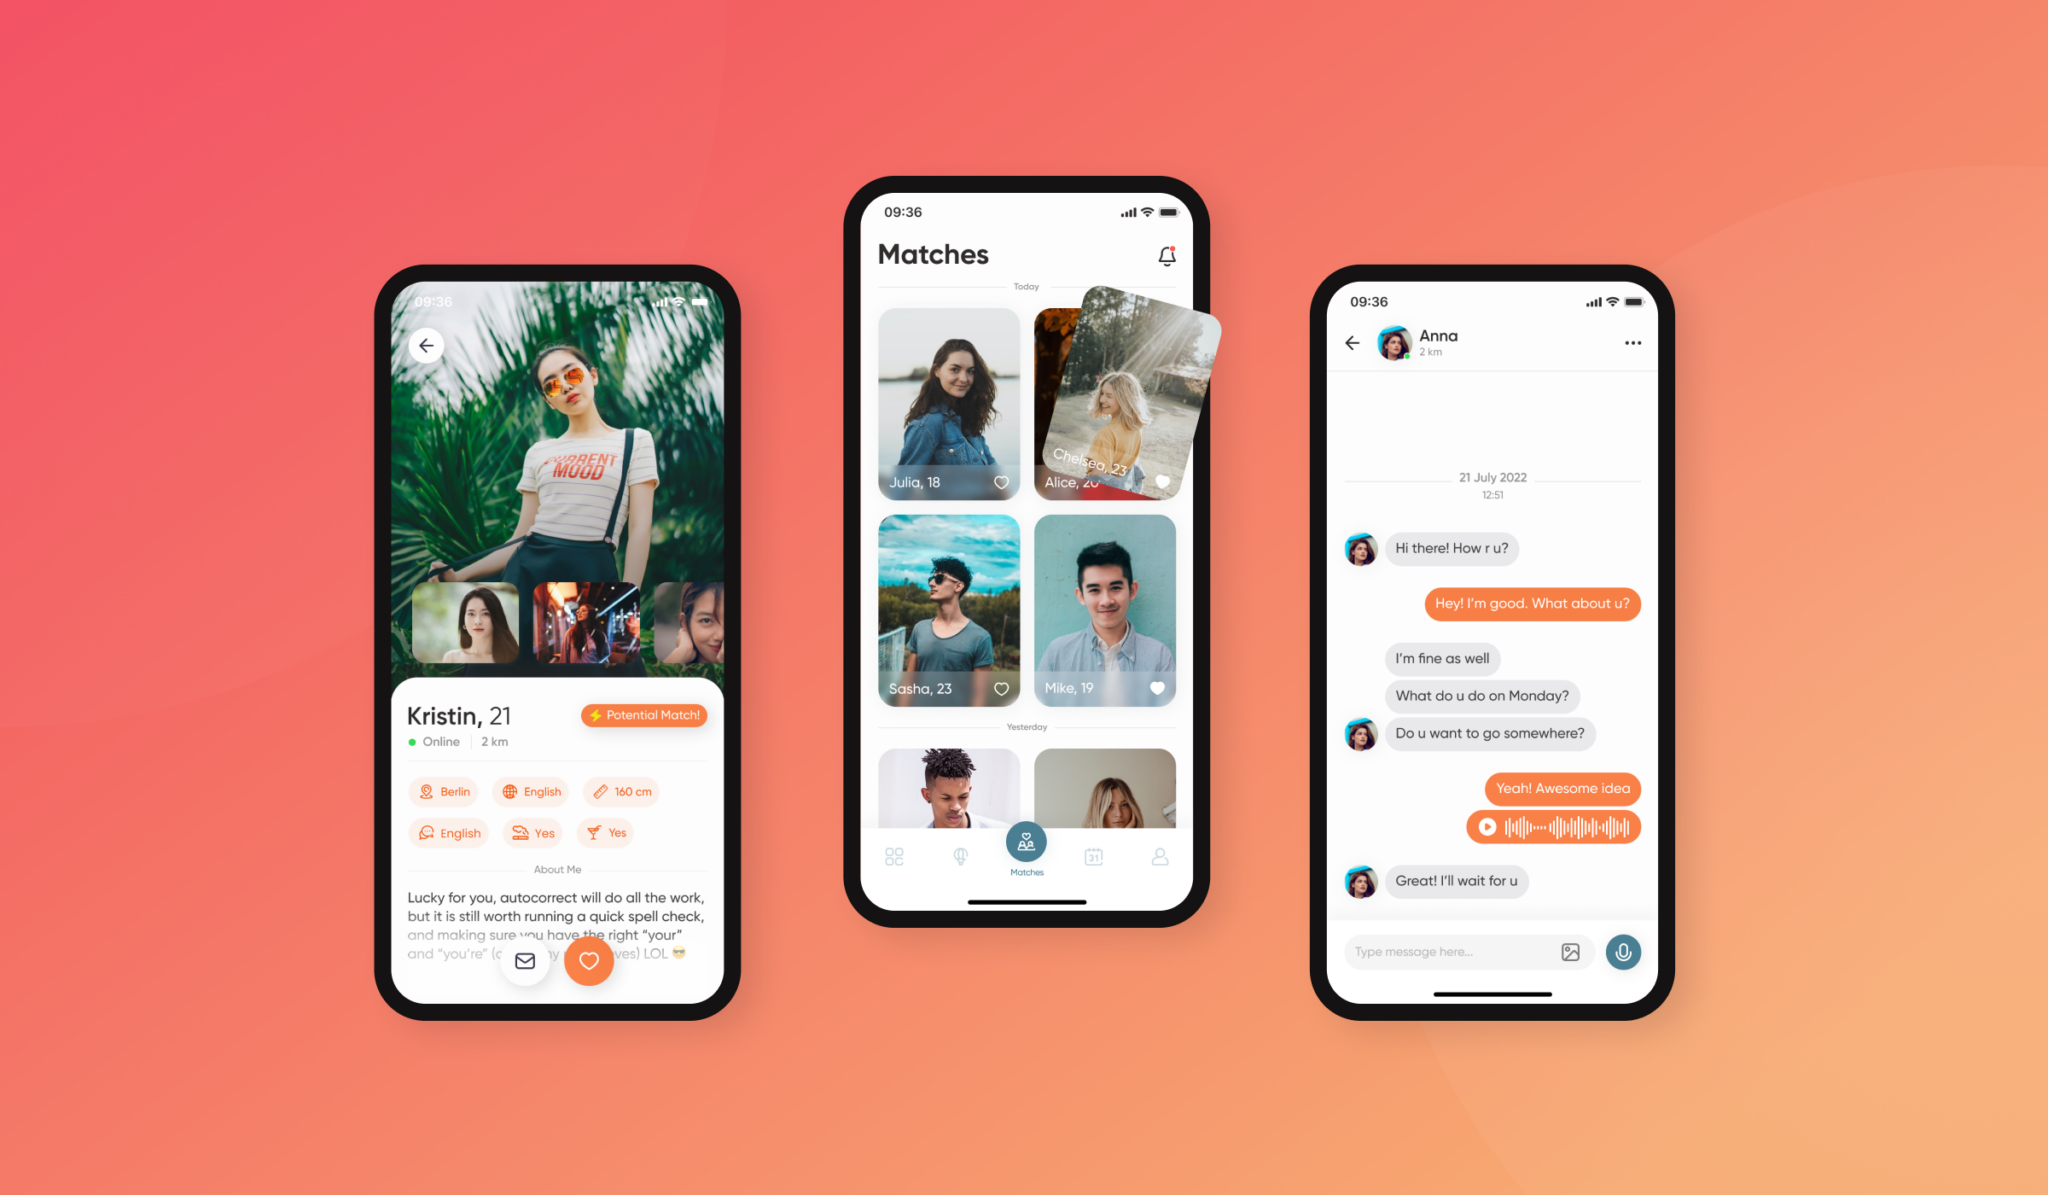
Code Refactoring & QA Testing For Dating Startup
Backend Development
, Mobile App Development
Our Team helped the Dutch-based company expand the functionality and complete the development of an advanced dating application.
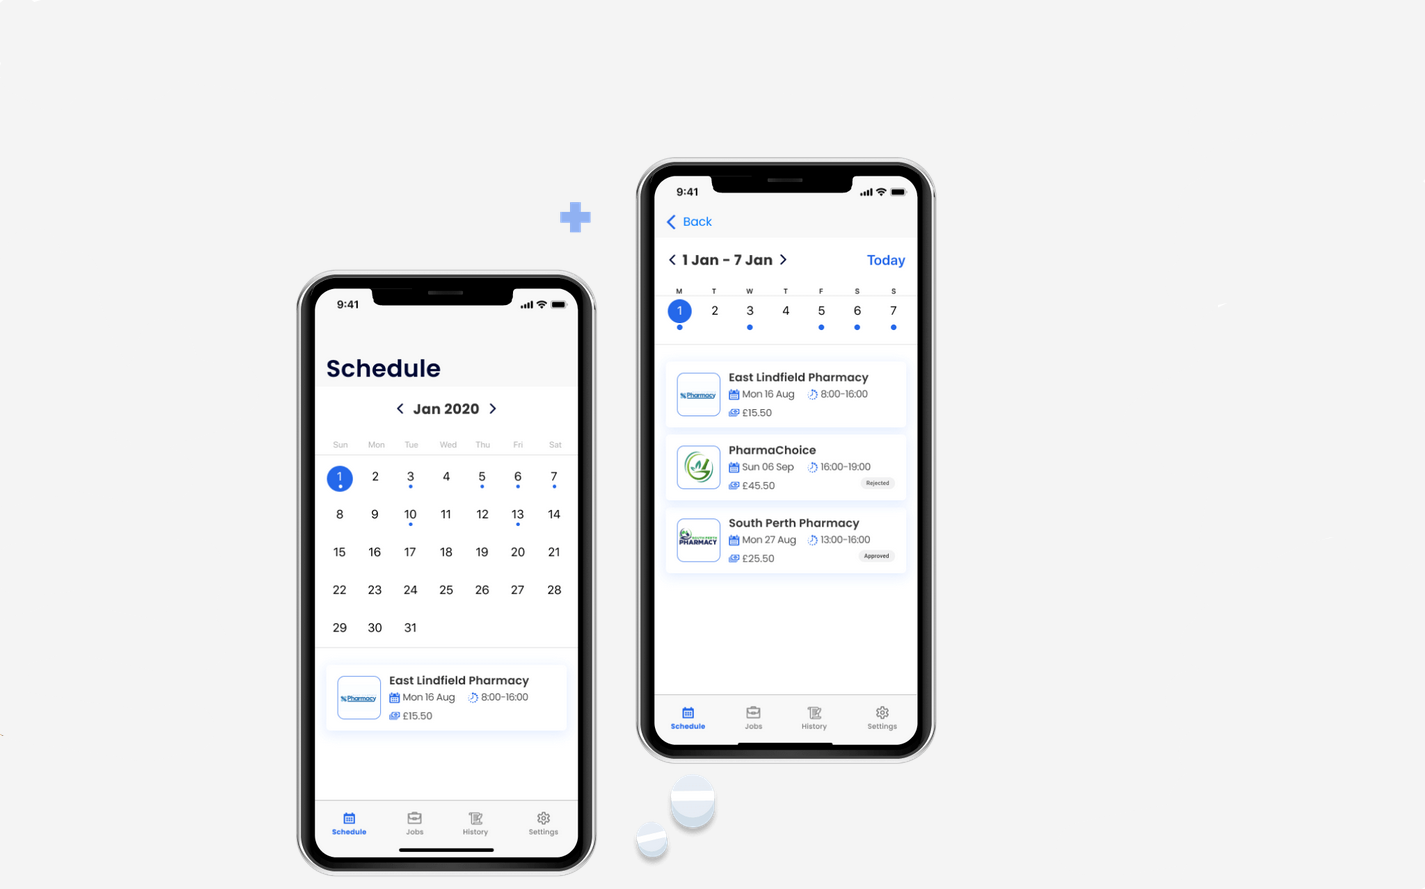
Pharmacies Staffing Web App
Backend Development
, Mobile App Development
, Web Development
We built recruitment platform that streamlines and automates the recruiting process in the UK pharmaceutical market and overcomes a long-standing industry problem.
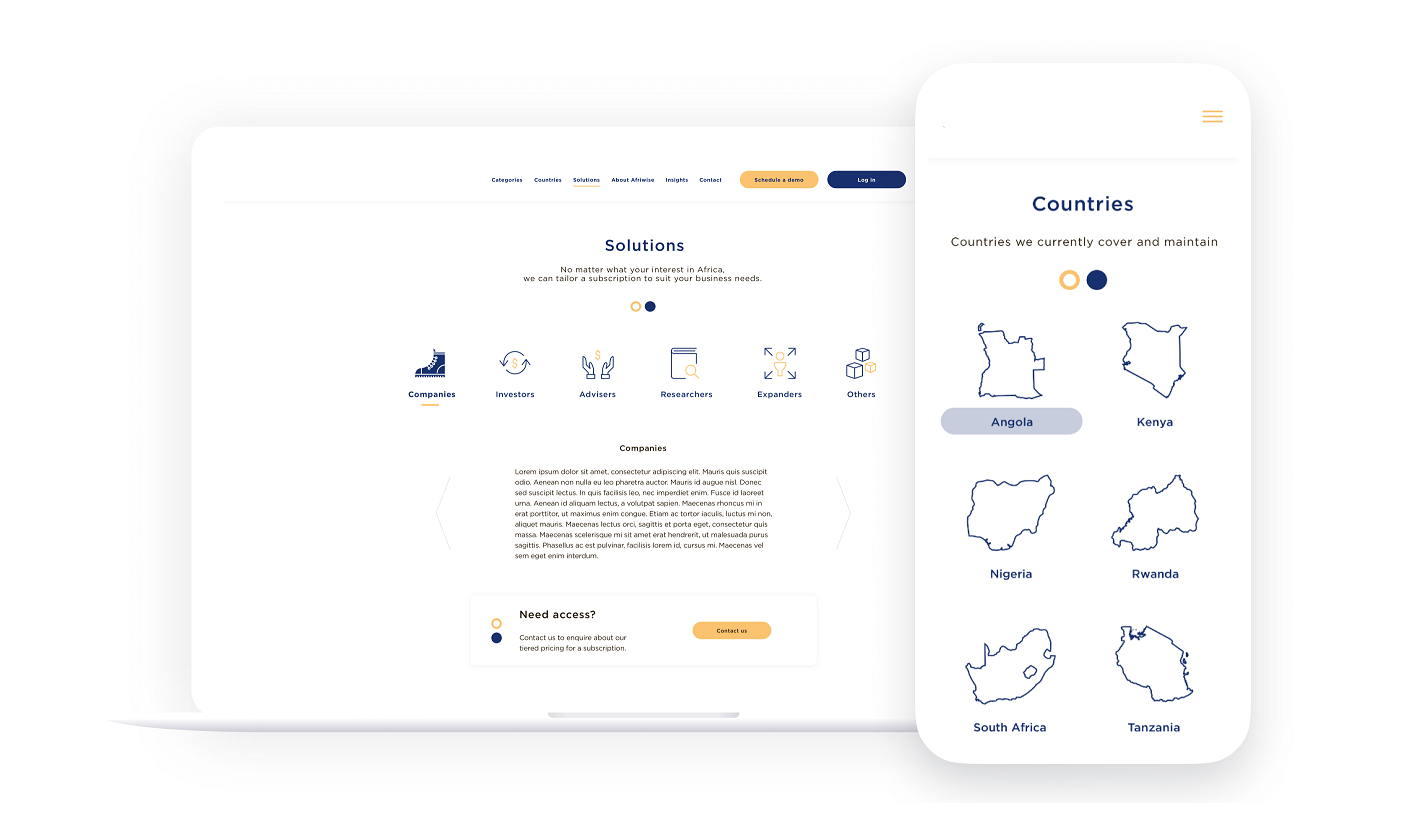
Web App for African Legal Industry
Backend Development
, Web Development
Our Team developed a web app for the Belgium based startup that act like legal bridge between Africa and Europe. It creates an easy door for companies to know the different regulations